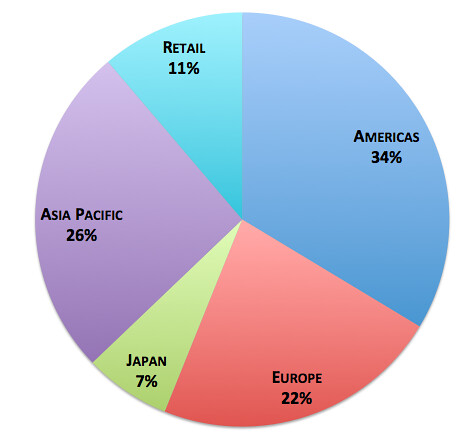
Following another one of Apple’s blowout quarters which sent shares of Apple back up to the $600 range, The Atlantic put together a few charts to help contextualize just where Apple’s money is coming from and what products continue to drive revenue to unprecedented heights.
Apple Revenue by Product
Here we Apple’s revenue broken up by product and not surprisingly, the iPhone is Apple’s main workhorse accounting for 58% of the company’s quarterly revenue. And though it’s been repeated ad nauseam, it’s worth noting, again, that Apple’s room for growth in the smartphone market remains immense, especially when you factor in the burgeoning market in China.

And speaking of, the Asia/Pacific area is becoming more and more of a contributing factor to Apple’s bottom line, exceeding revenues generated in Europe during the past quarter. The Americas still accounts for the bulk of Apple’s earnings, but as Apple continues to make headway in the Asia Pacific region of the globe, and in particular China, it may be sooner than later that sales abroad will account for more of Apple’s revenue than sales in the Americas.

The following chart, which measures product growth by region, further serves to illustrate how crucial the Asia Pacific area is to Apple with a growth rate that tops 100%. Also, note how impressive it is that Apple’s slowest revenue driver in terms of growth, retail, is still growing by nearly 40% year over year. Incredible.

And finally, we have Apple’s individual products divided along their respective growth rates. Macs are clearly not growing all that well, but that could very well be because users are patiently waiting for expected refreshes to Apple’s iMac and MacBook Pro line this Summer. And also looking quite limp is Apple’s iPod which, though once the golden goose of Apple’s stable, is now relegated to negative growth rates. When you look at the iPad and the iPhone, one can’t help but marvel at how the bulk of Apple’s profits are now derived from two products that didn’t even exist 5 years ago. Apple’s ability to enter new markets and create new revenue streams to keep earnings ever growing is remarkable.


Mon, Apr 30, 2012
Comments Off on Apple’s profits and growth rates visualized [Charts]